Project
ci-triage-mcp: Deterministic CI/CD Failure Triage, an MCP Server for Claude
Ask Claude why your last CI run failed — get a real answer built from parsed logs, not a guess from raw text.
Key highlights
- 🔍 Deterministic extraction — JUnit/Surefire XML, ESLint, tsc, Prettier, Maven console — never an LLM guessing from raw text
- 🔒 Human-gated repo allowlist — an agent-authored call cannot add its own approved repo
- 🐛 Six real bugs found and fixed via live testing against real CI failures, not fixtures
- 🔁 Standing `demo` branches on two real repos keep feeding it fresh failures instead of going stale
- 📊 Optional dashboard — `publish_triage` turns a triage into a shareable URL with category breakdown and recurrence tracking
Overview#
ci-triage-mcp is a Model Context Protocol ↗ server that answers one question well: why did this CI run actually fail? You ask, in conversation with Claude; the server fetches the GitHub Actions run and deterministically extracts the real failure signal — test name, class, assertion message, stack trace — from JUnit/Surefire XML, ESLint, tsc, Prettier, or Maven console output. Claude never reads a raw log to guess what went wrong; it reasons over structured data a real parser produced.
It’s the sibling project to k6-loadtest-mcp — same design: no API key, nothing running unattended, the “LLM” is whichever Claude client is already open when you ask.
Why I Built This#
The LLM plans and explains. Code fetches and parses. The two never trade places.
Pasting a 2,000-line CI log into a chat works, but it wastes context on install/browser-download noise and leaves the model guessing at which lines actually matter. This server does the mechanical part in real parsers — JUnit/Surefire XML via a proper XML parser, not regex on a raw log wherever structured output exists — so what Claude sees is already reduced to the handful of lines that are the failure. It also remembers: a local history store means “this test has failed the same way 3 times this month” is something the tool tells you, not something you have to recall.
Pipeline#
you: "why did the last run of playwright-typescript-framework fail?"
        │
        ▼
fetch_pipeline_run        → resolves the run, lists its jobs + artifacts
        │
        ▼
artifact named junit/surefire, and not expired?
   │ yes                                      │ no / 410 expired
   ▼                                          ▼
download + unzip artifact              get_job_log
parse JUnit/Surefire XML               parse ESLint / tsc / Prettier / Maven console
   │                                          │
   └──────────────────┬───────────────────────┘
                       ▼
        extract_failure_signal  → structured FailureSignal + stable signature
                       ▼
        find_similar_past_failures  → local history lookup
                       ▼
        host LLM writes the explanation from structured data
                       │
         ┌─────────────┴─────────────┐
         ▼ optional                  ▼ optional, ask first
 record_triage_note           publish_triage → shareable dashboard URL
(local history, no ask)triage_pipeline_failure chains all of this for a whole run — including falling back to job-log parsing per artifact instead of aborting if one has expired, which is itself a bug this project found in itself (more on that below). The granular tools exist for targeting one specific job.
The Guardrail: Agents Don’t Get to Expand Their Own Blast Radius#
Same shape as k6-loadtest-mcp’s host allowlist, on purpose: Actions data is only ever fetched for repos listed in allowedRepos, and the tools have no way to add to that list themselves.
// guardrails.ts
export function assertRepoAllowed(owner: string, repo: string): void {
  const full = `${owner}/${repo}`;
  const { allowedRepos } = loadConfig();
  if (!allowedRepos.includes(full)) {
    throw new Error(
      `Refusing to fetch CI data for "${full}" -- it is not in allowedRepos in ` +
        `~/.ci-triage-mcp/config.json. Add it yourself once you've confirmed you're authorized to ` +
        `read that repo's Actions data (the tools cannot expand this list themselves).`
    );
  }
}An agent-authored call — legitimate or prompt-injected — can ask for any repo, but reading its Actions runs, job logs, and artifacts requires a human to have already added it to a config file by hand. Same principle as k6-loadtest-mcp’s target-host allowlist, applied to “which repos’ CI data can this even see” instead of “which hosts can this send load at.”
Live Bugs, Not Hypothetical Ones#
The part of this project I keep coming back to: every non-trivial bug in it was found by actually running it against a real, failing CI run — not by reasoning about edge cases in the abstract. Six of them, across two rounds of testing:
- GitHub prefixes every job-log line with an ISO-8601 timestamp, silently breaking every
^-anchored regex parser until it’s stripped at the source. - A large-object assertion failure opens with a pretty-printed JSON dump before anything readable — the parser now prefers the annotated
> N | expect(...)source line instead of a bareError: [. - Playwright retries re-print the same failure block. A test that retries twice re-dumps the same JSON diff three times into what the parser treats as one failure — one real accessibility assertion produced a ~60KB
stackTraceon a single signal this way. Now capped at 4000 chars, everywhere. - An artifact GitHub still lists — with a real file size — can still 410 on download once it’s past retention.
triage_pipeline_failureused to let that one failure abort the entire run; it now falls back to job-log parsing per artifact instead. - The JSON-dump fix above only ever shipped for the console-log parser, not the XML parser — so the preferred, structured path was quietly producing a worse result (
"[") than the fallback path, for the identical failure. Found on the very next live test after fixing #4. - The Maven/Surefire console parser had never seen a real failure —
selenium-java-frameworkhad a 100% green CI history. Rather than leave that untested, I opened a throwaway branch with one assertion deliberately flipped, let the real workflow fail, triaged it live, then closed the PR unmerged. It worked on the first try.
That last one is why both playwright-typescript-framework and selenium-java-framework now carry a standing demo branch — main stays a clean, ready-to-clone framework skeleton, and demo exists purely to keep feeding this project real failures instead of letting its own test coverage go stale between now and whenever the next real CI failure happens to occur. It’s already paid off once: a WCAG contrast bug from the first real triage recurred organically in a later demo-branch run, completely unprompted — genuine recurrence data, not staged.
Dashboard: A Report That Outlives the Chat#
dashboard/ is an optional Spring Boot + Thymeleaf app — sibling to k6-loadtest-mcp’s own dashboard, same posture: a self-contained jar with its own embedded server, bearer-token-gated ingest separate from public/gated viewing. publish_triage posts a triage’s structured signals and the LLM’s own explanation to it, turning a result into a real, shareable URL.
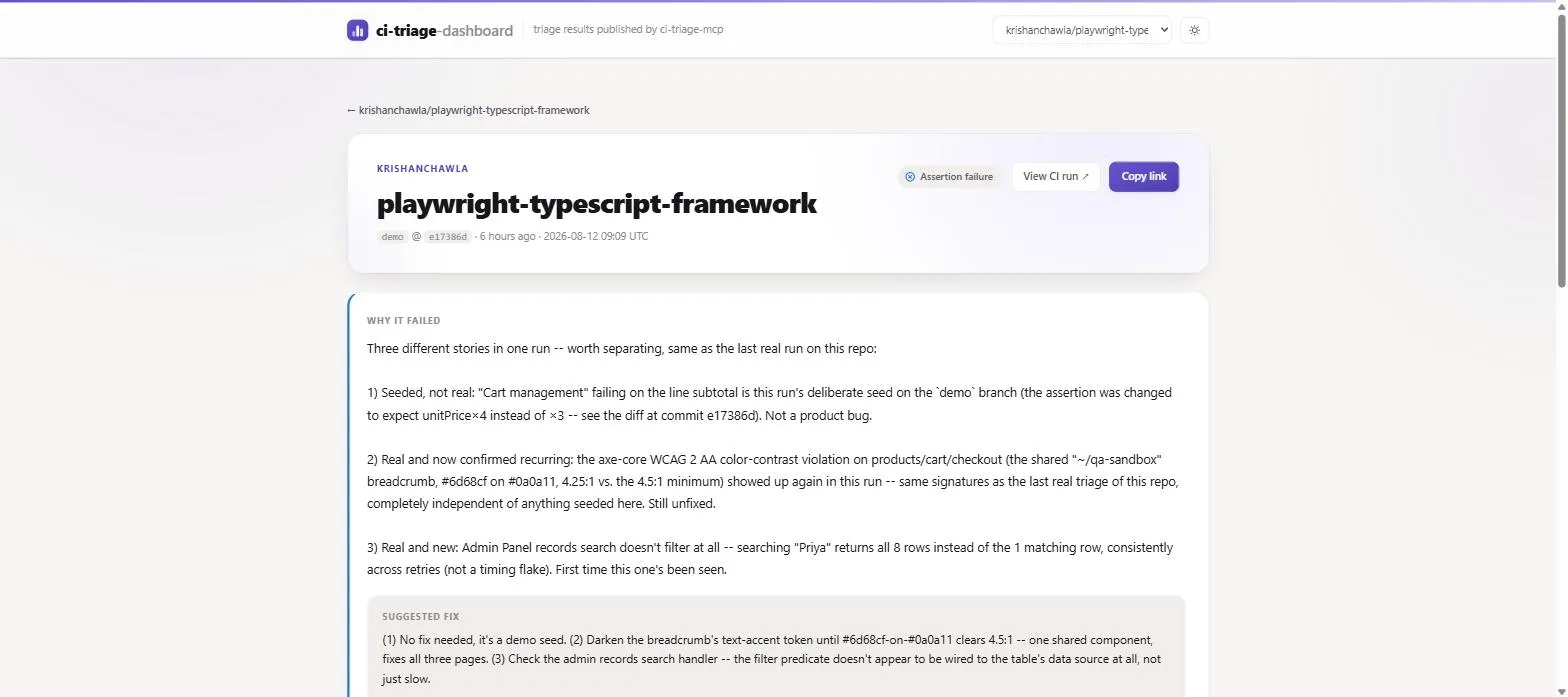
What it adds beyond just listing runs: a category breakdown across every extracted signal (a single run routinely mixes a real bug with unrelated infra flakiness — counting at the signal level is the only way that doesn’t get hidden), recurrence tracking by stable signature (“seen N× before” instead of treating every failure as novel), and a narrative-first detail page where the explanation and suggested fix are the headline, with raw stack traces behind a disclosure per signal.
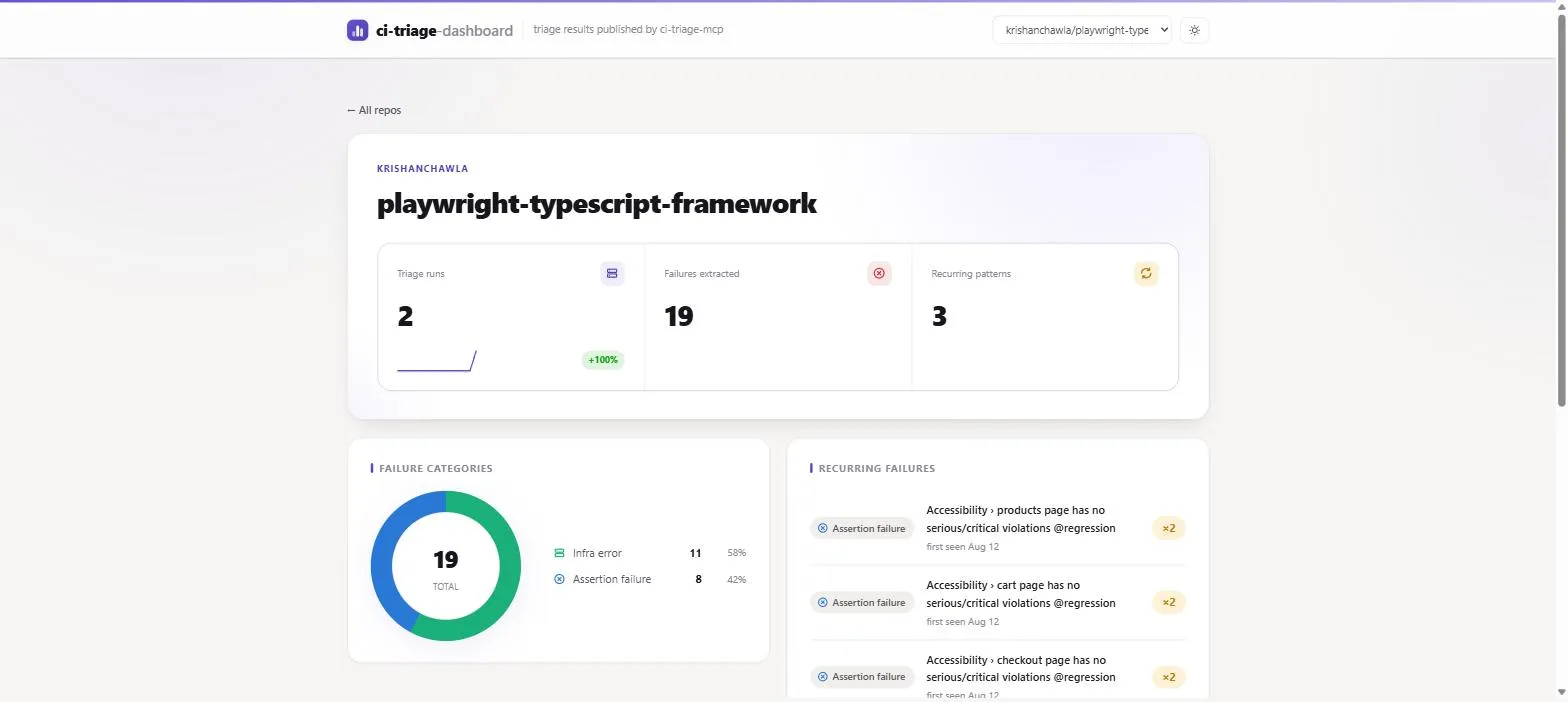
Both screenshots are the actual live dashboard, not staged — two real triages of playwright-typescript-framework’s demo branch, six hours apart, one WCAG bug recurring organically between them. Live at projects.krishanchawla.com/ai/ci-triage-dashboard ↗ — open to read without a login.
What I Learned#
- A guardrail the agent can bypass isn’t a guardrail —
allowedReposbeing config, not agent-writable state, is the entire point, same lesson as k6-loadtest-mcp’s host allowlist. - The “preferred” path isn’t automatically the better-tested one. Bug #5 above only exists because the structured-XML parser was assumed safe by virtue of being structured — it had quietly never gotten a fix its sibling parser needed for the exact same underlying problem.
- A parser is only as validated as the failures it’s actually seen.
selenium-java-framework’s Maven parser looked fine against a hand-written fixture and was completely unproven until a real failure existed to test it against — so I made one exist, deliberately, and reverted it. - Standing test infrastructure beats one-off validation. A throwaway branch proves a parser works once; a permanent
demobranch keeps proving it, and is what actually surfaced the organic bug recurrence that makes the dashboard’s recurrence-tracking feature demonstrably real instead of theoretically real.
What’s Not Here Yet#
- CI on this repo itself —
npm run harnessruns the extractor fixtures locally, but nothing runs it on push. A little ironic for a CI-triage tool. live-check.tsandtriage_pipeline_failurereimplement the same fetch → extract pipeline independently — they already drifted once (bug #4 above); worth factoring into one shared function both call.- Artifact upload for
selenium-java-framework— the console parser works now (see above), but atarget/surefire-reports/upload step would let it use the real JUnit XML parser instead, same asplaywright-typescript-frameworkalready does.
Source and full README: github.com/krishanchawla/ci-triage-mcp ↗